In my scripts, I have several "Debug.Break();".
I use them to halt the execution of the script when unexpected situations occur, for example like here:
 if (condition == 1)
 {
    DoThis();
 }
 else if (condition == 2)
 {
    DoThat();
 }
 else
 {
     //this should not happen! Check what goes on here
     Debug.Break();
 }
When my game hits such a "Debug.Break()", the gameplay is automatically paused.
It looks like this:
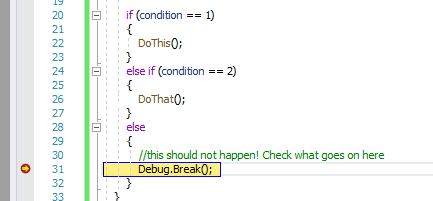
Ideally, I would have the Debugger attached, and I would have a breakpoint set, then Visual Studio would show me exactely where it stopped.
It would look like this:
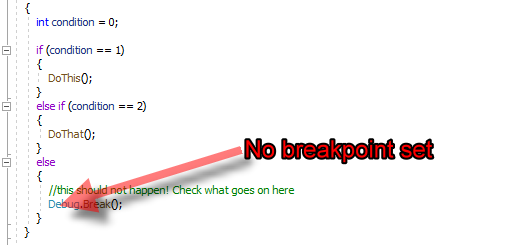
However, I don't have breakpoints at all Debug.Break(); and sometimes I do not even have the Debugger attached to Unity.
It would look like that:
How could I anyways still step into the line where Unity halted? I would like to see where exactely Unity halted, but I don't see how.
Do I always have to have breakpoints set and the Debugger attached? Or could I still attach the debugger later and still step into where the script halted?
The reason why I don't have the Debugger attached at all time is that I frequently change the scripts, then I need to save it and detach and re-attach the Debugger. This is too time-taking.
I am using Visual Studio Community Edition.


