24
\$\begingroup\$

Problem

Player obtains 5 points per level up to level 80 with a maximum of 400. There are 5 stats to be distributed to and no maximum limit to how much you can add to a stat.

  • Strength
  • Endurance
  • Intelligence
  • Agility
  • Luck - Grants critical chance and critical damage

I would like to implement a diminishing return equation on let's say Luck. For critical chance, I do not wish for the player to be able to hit 100% critical chance.

There will be a ceiling to which it will reach as the increasingly decreasing growth reaches towards 0 per point added.

Example if the maximum critical chance I want the player to have is 40%, Each point into luck will increase critical chance lesser and lesser, until the critical chance reaches around 40%. By which 1 luck will give a very very miniscule amount.

Any solutions? Thank you and your help is greatly appreciated!

\$\endgroup\$
2
  • \$\begingroup\$ Possible duplicate of How to develop RPG Damage Formulas? - tl;dr the keyword you're looking for is sigmoid curve \$\endgroup\$ Commented Oct 21, 2015 at 17:06
  • \$\begingroup\$ @BlueRaja I think that's not a duplicate. This question is about diminishing-return functions generally—that one is about damage-calculation. As it happens, the answers to that one have mostly discussed diminishing-return functions, but I think the questions are still clearly different. \$\endgroup\$
    – Anko
    Commented Oct 22, 2015 at 9:46

5 Answers 5

36
\$\begingroup\$

You want to start with an asymptotic function. That is, one that starts at a number a and approaches another number b, but never actually reaches it. It's probably going to be easiest if a = 0 and b = 1. You'll take this equation, input the number of stat points (Luck points) the character has, and get the actual stat value (Crit Chance) as the output.

A very simple example is y = x / (x + n) where n is some positive constant. Here x is your input, where you feed in the number of stat points, and y is your output, where you get the final stat value.

For n = 5 check out what it looks like:

y=x/(x+5) plot for x in [0,100]

When you feed in x = 0 you get y = 0, but no matter how big an x you put in, y never quite reaches 1. Perfect.

Now, you can tune this to your hearts desire. You can multiply by a scale factor to set the 'cap' to whatever you want. y = a * x / (x + 5). If you want the cap to be 40%, multiply by .4. y = .4 * x / (x + n). Now when you feed in x's, y will increase but it will never quite reach .4.

Adjust n to set how fast or slow the equation ramps up. n = 100 is going to increase a lot slower than n = 5:

y=x/(x+100) plot for x in [0,400]

You can solve this equation for n if you know you want the stat value you want to reach at a specific number stat points. Let's say the character should have 35% Crit Chance at 100 points of Luck. Solving .35 = .4 * 100 / (100 + n) for n yields n = 14.29.

These numbers don't have to be raw constants either. Maybe other stats go into calculating the values of n. Maybe some characters have different n's so they scale better in their 'preferred' stat.

If you want a curve that's shaped differently or is more complex, there are many other examples of asymptotic functions you could use as well. I'll leave you to explore that as you wish.

\$\endgroup\$
6
  • 4
    \$\begingroup\$ My favourite curve is the exponential one. Just take a fixed ratio of the remaining pool with each level. \$\endgroup\$ Commented Oct 20, 2015 at 9:57
  • \$\begingroup\$ @JanDvorak for completeness, can you provide an example? There are lots of exponential curves and a reader may not know how to apply your suggestion from the previous comment alone. \$\endgroup\$
    – Adam
    Commented Oct 20, 2015 at 13:58
  • 1
    \$\begingroup\$ This is a good starting point and the mathematics are explained well, but keep in mind you can't just pick a function that looks good; this problem requires careful consideration and lots of tweaking. For example, one of the downsides of this method is its discouragement of specialisation. If all of the five stats are equally viable, points spent on the least developed one will be the most valuable (and the most developed one the least). The ideal build would be an equal distribution of points, which makes the player's choice on how to spend them less interesting. \$\endgroup\$ Commented Oct 20, 2015 at 14:55
  • \$\begingroup\$ @MarcksThomas That presumes no synergy between attributes, or ability to tactically isolate an attribute and "win" with it. As an example, imagine an amazing archer who ups their agility to the point that foes die before they reach them: even if agility had diminishing effectiveness, the tactic chosen makes the other attributes unimportant. Another tactic involving strength might be equally effective, so the attributes are of "equal value", but tactics often mean that specialization is dominant. If your attribute system rewards specialization as well, the game diverges. \$\endgroup\$
    – Yakk
    Commented Oct 20, 2015 at 17:01
  • \$\begingroup\$ I call this the "draw stones out of a bag" system. The value P = x/(x+n) is the probability, given a bag with n black stones and x white stones, that you draw a white stone out of the bag blind. One approach you can do is make crits set X=your luck, and N=their luck. Your chance to crit is then 50% if you have the same luck as your foe. If you want the base chance to be 10%, then us X=your luck, N=9x their luck. \$\endgroup\$
    – Yakk
    Commented Oct 20, 2015 at 17:03
11
\$\begingroup\$

A good base would be a function like arctan, since it passes through the origin and exhibits a horizontal asymptote.

arctan

Scale it by 40 / (pi/2), or 80/pi for your desired limit. Then transform luck to get the curve steepness that you want.

critical = 80/pi * arctan(f(luck))
\$\endgroup\$
10
\$\begingroup\$

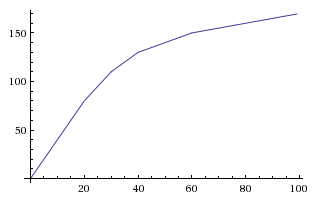
I really like the way that the Souls games tackle this problem. Rather than making each stat give bonuses based on a continuous function as has been suggested, it gives bonuses in a piecewise linear function.

I can't remember the exact numbers off the top of my head, but the functions are along the lines of the following (each stat has its own constants)

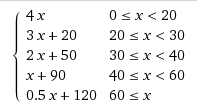
{0 <= x < 20 : y = 4x, 20 <= x < 30 : y = 3x + 20, 30 <= x < 40 : y = 2x + 50, 40 <= x < 60 : y = 1x + 90, 60 <= x : y = 0.5x + 120}

Plot

This method provides many benefits to the designer and the player. The designer benefits as you can tune the exact benefit per point in a skill fairly trivially, and the player benefits as they know exactly how much benefit they will see from level to level.

In the case of a continuous function, some levels might give a benefit that doesn't get reflected in the numbers due to measurement aliasing. Sure that last level gave you a 0.9 increase in bonus XYZ, but since the actual value went from 23.52 to 24.42, and you round the number prior to displaying it, the player doesn't realize something has changed.

From a UX perspective, I would definitely suggest going with a piecewise linear function. However, using a continuous function can be easier to tune later down the line, as players won't be as attached to round constants.

\$\endgroup\$
4
  • 1
    \$\begingroup\$ Approximation of a curve that doesn't require much math, and simple to change. I like it. :) \$\endgroup\$ Commented Oct 20, 2015 at 18:36
  • \$\begingroup\$ > you round the number prior to displaying it => one way of compensating is to ceil the increase amount before adding, and only allow integer stat levels. or floor then x <= 0: x = 1 to avoid accidentally going over the soft cap. \$\endgroup\$
    – Bob
    Commented Oct 20, 2015 at 18:38
  • 1
    \$\begingroup\$ While you can still do a piecewise function, it doesn't have the effect you're looking for here. Luck value is a percentage, with a max of 400 rating. This means every rating point must result in a sub-1% gain in value, even in a linear function with 100% luck. The trick is just showing enough decimal points that y(399) is different from y(400). Your function does the same thing by making y grow very large so increases can always be integral. At x=40, y is more than 4 times the value of x. \$\endgroup\$
    – MichaelS
    Commented Oct 21, 2015 at 8:50
  • \$\begingroup\$ @MichaelS I was just giving an example of the type of function used in Dark Souls. It would need to be balanced differently depending on the situation it's applied to, but my point still stands that players will understand the effect of a piecewise linear function much more readily than an arctangent curve or conic section. \$\endgroup\$
    – Kaslai
    Commented Oct 21, 2015 at 15:36
4
\$\begingroup\$

Jan Dvorak points out the exponential function in a comment. I'll explain it here.

Note that exponential (and trig) operations are considerably more computationally expensive than even square root operations, which are themselves far worse than basic math, so you're probably better off with Adam's approach if you'll be doing these calculations many times per second. If you just calculate the values when the player levels, changes equipment, etc., speed isn't important, so use whatever gives you the best curve.

An exponential function is some base, B, to some power, x, y=B^x. Mathematicians commonly use a base of e, (~= 2.718), but there's no reason you can't use 2 or 10 if you prefer.

y=e^x looks like this: y=e^x

Notice the left side is moving asympotically to 0. So we can flip the x-axis by doing y=e^(-x), but it's still descending from 1 to 0 and we want it to ascend. So we can flip it across the y-axis with y=-e^(-x). Now it's ascending from -1 to 0. We can add 1 to get y=1- e^(-x) and it's ascending from 0 to 1.

y=1-e^(-x)

From here, it's just a matter of scaling it vertically and horizontally. We can multiply the entire thing by some value, let's call it A, that sets the asymptotic limit. Then we can multiply x by a rate-of-change value, k, to adjust how quickly it closes in on the limit.

This gives us a final equation of y=A*(1 - e^(-k*x)). Using values of k=0.012 and A=0.5, we can set the limit to 50% and let it get pretty close to that limit around x=400.

y=0.5*(1-e^(-0.012*k))

Now, you can make a few tweaks to this. One tweak I made was changing to A=0.5041, so if we round to a percentage with 2 decimals (like 32.23%), y(399) = 49.99% and y(400) = 50.00%. From y(347) onward, there are several places where it takes two points to get a change of 0.01%. But that last possible point still gives a (barely) tangible benefit, and brings it to an even 50%.

Alternately, we could tweak the k value to have a similar effect. At k=0.02305, the value rounds to 49.99% at y=399 and 50.00% at y=400. However, this has the problem that the graph is very shallow at the end -- it takes 48 points to get that last hundredth of a percent (from y(352)=49.99% to y(399)=49.99% to y(400)=50.00%) and the last 1% crit chance takes a whopping 230 points (from y(170)=49.01% to y(400)=50.00%) which is probably a bit too diminishing on returns.

If you wanted, you could adjust both A and k so it's diminishing to a somewhat higher limit at a slower rate, to give something between linear and exponential decay. Doing y=0.6*(1-e^(-0.00447*x)), you end up with this: y=0.6*(1-e^(-0.00447*x))
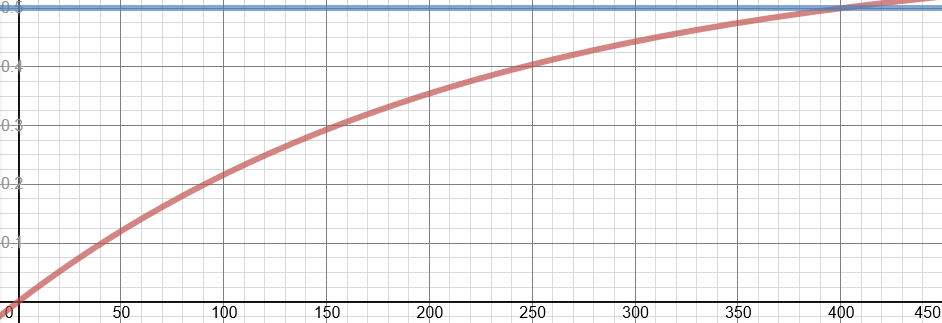
Note that the curve continues past 50%, but since there's a hard limit of 400 rating, the player can't pass that point (and if they do manage to pass it, there's still a hard limit of 60% crit). With this equation, you can use 1 decimal place and still see gains every 2 to 3 points, with a final tick from y(399)=49.9% to y(400)=50.0%.

Mathematically, the earlier equations might seem better, since they're actually approaching 50%, but I personally think gains of 0.1% every couple points feels better than gains of 0.01%. Even with A=0.05041 and k=0.012, it takes 102 points to go from y(298)=49.00% to y(400)=50.00%. 25% of your points spend on 2% of your crit is probably too diminished. The 60% equation only takes 20 points for the last percent (which is still 5 times higher than the 4 points needed for the first percent).

With these last several equations, I just plugged the equations into a spreadsheet and manually tweaked values until they looked good. You'd have to do something similar if you wanted a different cap.

\$\endgroup\$
1
  • 2
    \$\begingroup\$ The note on the relative speed of math operations is correct, but probably irrelevant for player stats. Bottlenecks in modern games are usually the stuff that handles many thousands of items per frame (eg. physics & rendering). Gameplay scripts that probably run a few dozens of times per frame are unlikely to be a blip relative to this, and are generally full of cache misses anyway which are going to leave the CPU plenty of thumb-twiddling time to do any math you like. tl;dr: Don't feel pressured to avoid expensive ops unless you're writing shaders or other stuff that needs to run huge batches \$\endgroup\$
    – DMGregory
    Commented Oct 21, 2015 at 16:24
-1
\$\begingroup\$

For a very simple solution, how about square root x 2

The square root of 400 (max possible) is 20, 20*2 = 40.

\$\endgroup\$
3
  • \$\begingroup\$ Why the down vote? It solves the asked question and is simple which was also asked for. \$\endgroup\$
    – Catwood
    Commented Oct 21, 2015 at 15:23
  • 1
    \$\begingroup\$ I'm not the downvoter, but it was probably because your answer is overly specific and doesn't supply any information which hasn't already been provided (a square root is just exponentiation to the power of 1/2) and you don't explain the reasons why this could be useful. \$\endgroup\$
    – Kaslai
    Commented Oct 21, 2015 at 15:56
  • \$\begingroup\$ I did not downvote, but I don't think this is a good answer because it is not very flexible - square-root is not asymptotic, so if the max level ever changes, you need to change the formula in order to keep the max stat the same. \$\endgroup\$ Commented Oct 21, 2015 at 17:10

You must log in to answer this question.

Not the answer you're looking for? Browse other questions tagged .