2
\$\begingroup\$

I'm making a cooking game and one of the minigames in the game is to put ingredients on a barbeque. As it's being cooked, a progress bar is displayed, with a range between 0-1.

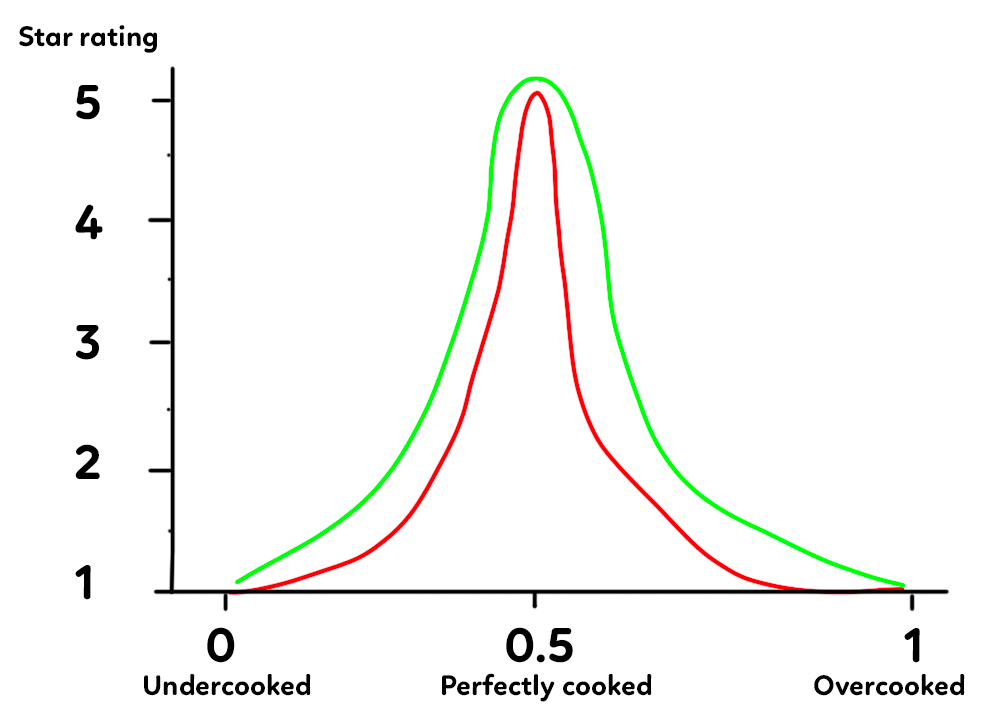
The goal is to take it off the barbeque at the "perfect point", which would give you a score between 1-5, in the form of a star rating. The "perfect point" in my example image is 0.5, but could vary between ingredients, so it can for example be closer to 1, when the ingredient is burned/destroyed.

Also depending on the difficulty of the ingredient, the slope to get a 5 star rating can be narrower (red line) which makes it harder or broader (green line) which makes it easier. This is currently set as the factor variable in the code below.

What mathematical function can I use to get a shape more like the image? Also, can you recommend an online tool to visualize the curve and how the values change it?

I'm currently using the code below, but I don't like that much how it works:

// The result is then capped between 0-1 and remapped to 1-5 stars,
// but that's not important for this question. :)

// Varies based on user input
float progress = 0.4f; 

// Set per ingredient
float perfectPosition = 0.5f; 
float factor = 1.3f;

// Calculation
float distFromPerfectPosition = Mathf.Abs(perfectPosition - progress);
float result = 1 - Mathf.Pow(distFromPerfectPosition, factor);

Thank you in advance!

enter image description here

\$\endgroup\$
1
  • 2
    \$\begingroup\$ I use desmos when I need to tweak a formula. \$\endgroup\$
    – Vaillancourt
    Commented Oct 8, 2022 at 17:56

2 Answers 2

6
\$\begingroup\$

Myself, I like to hop into a spreadsheet to play with formulas like these.

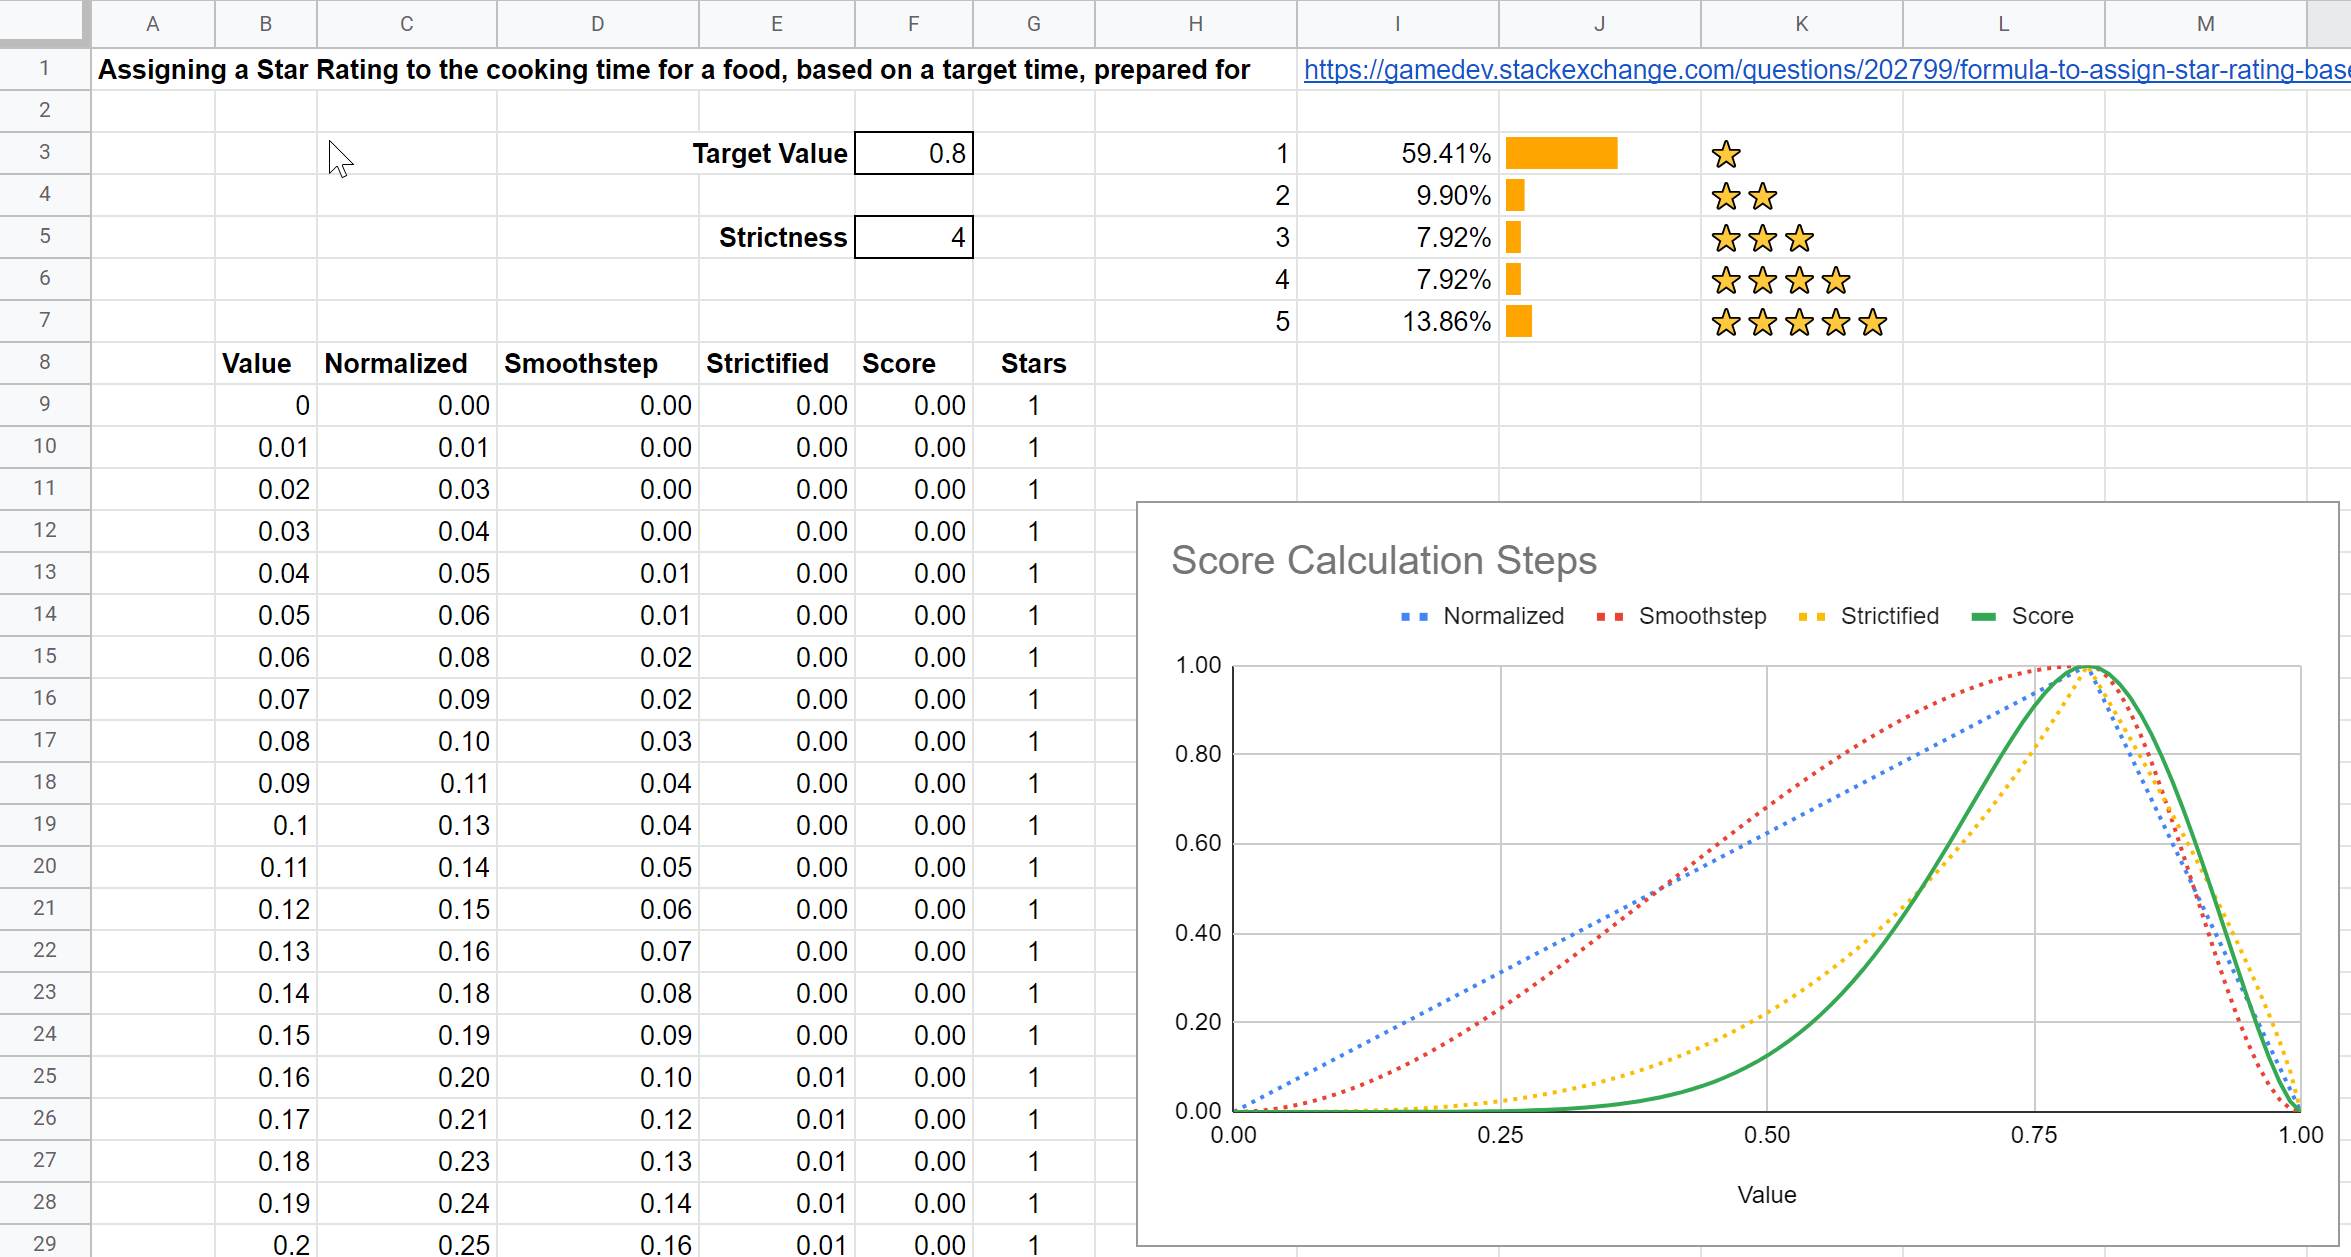
Check the "Cooking Stars" tab of this workbook for one way we could tackle it.
You can download it or make a copy so you can edit it and play with the numbers to see how it behaves.

enter image description here

Here's a walkthrough of my process:

First, I wanted to make the two sides of the curve behave the same for our math. So I make a "normalized" value that rises from 0 at time zero to 1 at the "perfect point" (called TargetValue in my spreadsheet), and then sinks from 1 to 0 again by the end of the interval at time one:

$$\text {normalized} = \begin{cases} \frac x {\text {target value}}, & x \le \text{target value}\\ \frac {1 - x} {1 - \text {target value}}, & x > \text{target value}\\ \end{cases}$$

That gives us a "curve" that's really just peaked roof, with two straight sides meeting at a sharp corner at (target value, 1), then sloping down to (0, 0) and (1, 0) on either side. That's the blue dashed line in the graph above.

We can turn a linear ramp between 0 and 1 like this into a smooth sigmoid curve using the smoothstep function:

$$\text{smooth}(x) = 3 x ^2 - 2 x^3$$

Applying this to our normalized value between 0 and 1 gives us the red dashed curve in the graph. This has the rough shape we want, but the peak is too broad, and not symmetrical: if we have a target value on the high side like 0.8, the long interval on the left has a much more gentle ramp-up than the short interval on the right. We also might like to be able to shape how tight the peak is.

So let's add another variable, "strictness", and warp our normalized value from earlier into a "strictified" value like so:

$$\text{strictified} = \begin{cases} \text{normalized}^{\text {strictness} \times \text{target value}}, & x \le \text{target value}\\ \text{normalized}^{\text {strictness} \times \left( 1 - \text{target value} \right)}, & x > \text{target value}\\ \end{cases}$$

Raising a number in [0, 1] to a power > 1 like this bends it into a curve, shrinking most of the values toward zero and making the rise to 1 at the end steeper. That makes our 5⭐ range narrower. By applying a higher power on the side with the wider interval, we squeeze that side of the peak correspondingly more aggressively, while going gentler on the side with the narrower gap to fill, overall making the peak in our score function more symmetrical in shape.

FInally we can apply smoothstep to that strictified value to get a final score. We can multiply the value by 4, add one, and round to an integer to get our star count.

You can make the strictness number higher to make the peak of the curve narrower, or lower to make the peak wider.

\$\endgroup\$
2
  • \$\begingroup\$ This is brilliant, thank you so much for your calculations and work. The only minor issue I see is that at score = 1 you get 6 stars. And also it seems I need to reverse engineer the formula to get into usable code in my game, based on the steps in the sheet, since it has some if's. Thank you again! \$\endgroup\$ Commented Oct 9, 2022 at 5:08
  • \$\begingroup\$ Oops, missed that! I switched it to a round instead of floor which also has the effect of giving a slightly larger catchment area for the intermediate scores of 2-4 stars, while making 5-star a little more exacting. \$\endgroup\$
    – DMGregory
    Commented Oct 9, 2022 at 17:00
2
\$\begingroup\$

Try this:

float result = Mathf.Exp(-factor * (perfectPosition - progress) * (perfectPosition - progress));

then you would have what is essentially a normal distribution, which is the sort of shape that would make sense here.

As for visualizing curves, I'm sure there are better options, but for a general set of tools I use https://www.wolframalpha.com/ . It does that and a whole lot more.

\$\endgroup\$

You must log in to answer this question.

Not the answer you're looking for? Browse other questions tagged .