0
\$\begingroup\$

Today I downloaded Nvidia Nsight in order to profe my game GPU side and I came across some doubts:

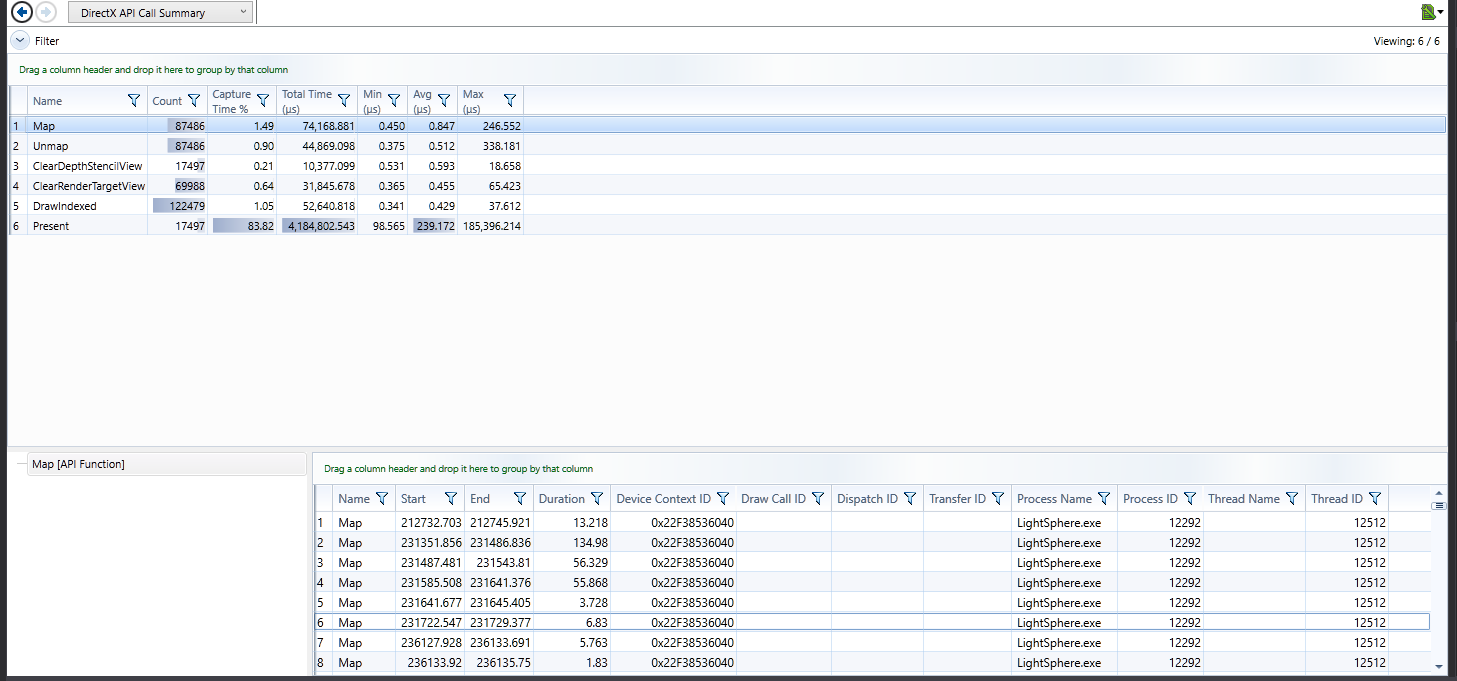
  • I can't find only any resource of what are the average times for the different DirectX functions (such as map/unmap, clear the target view, draw (even if is strongly dependant on shader and similar my are really basic), ...) and so I can't know if my values are normal or not. For example for the map function (with write_discard) I've got an average of 0.8-1 microseconds.

  • There are always peaks in each function: map() for example goes up to 200 microseconds (randomly and rarely).

Here's a screenshot:

screeenshot

Is it normal?

\$\endgroup\$
3
  • \$\begingroup\$ Time the call your self, you can wrap every call you make to the API and return the gpu time for that call. msdn.microsoft.com/en-us/library/windows/desktop/… I know that to build my instance buffer using Map\unmap it can take from 0.05ms to 0.1ms, I use sharpDX so I get a 2.5x perf hit I think \$\endgroup\$ Commented Apr 26, 2017 at 12:03
  • \$\begingroup\$ @JustinWilliamStanleyBryant so my times are totally fine. Aren't they? \$\endgroup\$
    – Liuka
    Commented Apr 26, 2017 at 15:41
  • 1
    \$\begingroup\$ From what I understand, they are fine. I don't want to make an answer because I'm not 100% but your timings seem good. \$\endgroup\$ Commented Apr 27, 2017 at 1:21

2 Answers 2

1
\$\begingroup\$

You're unlikely to find comprehensive resources on what the "average time" for D3D calls is. Any given D3D call is generally going to involve three things that seriously impact performance:

  • the front-end part of the function, implemented in the D3D library
  • the back-end part of the function, implemented by the driver
  • the algorithm used by the function, impacted by the data you give it

Only that first aspect is likely to be fixed broadly enough to collect "average" timings, but the impact of the other two aspects would likely overwhelm the first anyway. So "average" timings aren't very useful.

If your game is running acceptably, you shouldn't worry about those profiling numbers. They're "fine." If your game isn't, it may be worth investigating more deeply why you get those spikes or whatever. But there isn't enough information present in your question to provide much further guidance.

\$\endgroup\$
1
  • \$\begingroup\$ Thanks for the answer, but being honest I don't even remember where I found this issue :) \$\endgroup\$
    – Liuka
    Commented Oct 11, 2018 at 17:19
0
\$\begingroup\$

It is also the matter how you call Map(), for example a MAP_WRITE_DISCARD can take more time than using MAP_NO_OVERWRITE because of their contracts. DISCARD will give you a new allocation, NO_OVERWRITE is saying that your allocation is safe to be written to, just get the pointer to it. Not only these can affect your performance, but how big and much data you actually copy into these mapped buffers. Your best bet is to profile them with a real CPU profiler or inserting some timers of your own.

\$\endgroup\$

You must log in to answer this question.

Not the answer you're looking for? Browse other questions tagged .