I am trying to add spherical harmonics based ambient lighting to my game but have run into some problems and while trying to solve this I have reduced the test scene to the following very basic scenario.
The scene consists of
Two walls (red and green)
Single light probe in the middle. Since a probe is just empty space there need to be some ‘normal’ vector used when integrating over the hemisphere (defined by that vector). To fit this simple example this probe only have two such vectors pointing in opposite directions (i.e. at each wall).
The light source is rotated 360 degrees (2*PI radians) while the final light solution is evaluated in the two directions.
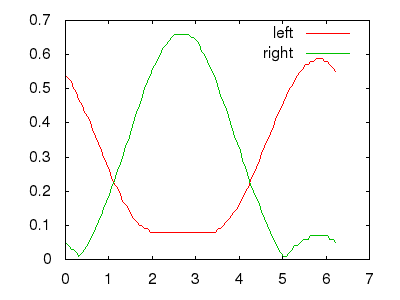
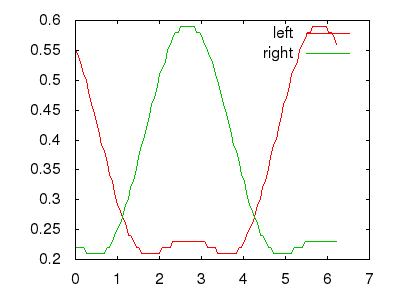
Now if I simply plot the magnitude of the two light color vectors I get
Since the scene is symmetrical except for the colors I would expect that the magnitude of the ‘color vectors’ (as plotted above) to be identical except for a phase shift. This, however, does not appear to be the case and this is my problem.
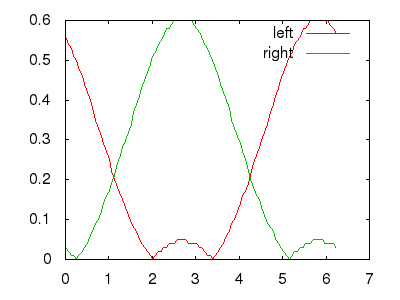
Further if I simply plot the shadowed solution (i.e. exclude the bounced coefficients), I get
which is what I expect (i.e. seemingly identical except for a phase shift).
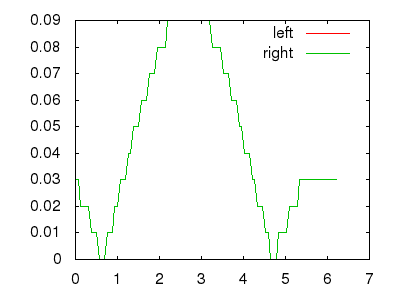
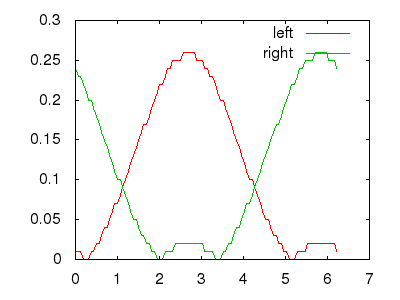
Also, if I just take the bounced coefficients into account (i.e. exclude the shadowed), then I get
which again looks reasonable in that the two curves are identical (the color components, not visible in this plot, are rearranged but the magnitude stays the same).
As far as I know I am supposed to be able to add the two coefficient sets (shadowed and bounced) to get the final result but when I do, it just looks wrong as can be seen in the first plot.
I have been stuck on this for quite a while now so if anyone could offer some advice I would appreciate it. I'd be happy to post more details if there is any interest.

